Maxwell-Boltzmann Demo
Demonstration of the Maxwell-Boltzmann module in LTEpy.
[1]:
import matplotlib.pyplot as plt

from LTEpy import lte
Define a new instance of an LTEpy Maxwell-Boltzmann object for a given temperature
[2]:
temp = 1000  # temperature in K
mass = 1     # mass in AMU
maxwell_boltzmann = lte.Maxwell_Boltzmann(temp, mass)
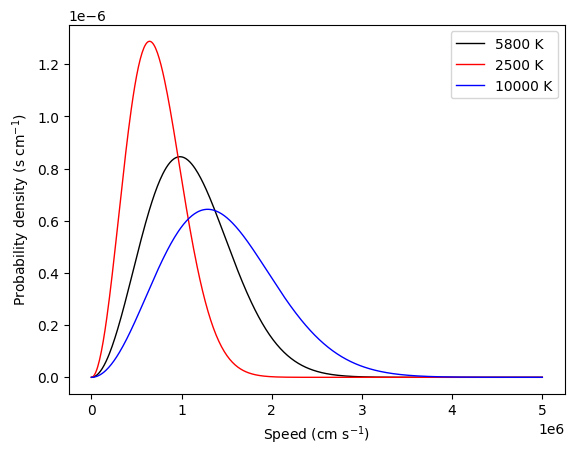
Plot \(f(v)\) on a given speed interval for different temperatures
[3]:
speed_start = 1e1  # starting speed in cm/s
speed_end = 5e6   # ending speed in cm/s

fig, ax = plt.subplots()

maxwell_boltzmann.set_mass(1)
maxwell_boltzmann.set_temp(5800)
maxwell_boltzmann.plot_fv(speed_start, speed_end, ax=ax, c="k", ls="-", label="{:} K".format(maxwell_boltzmann.temp))

maxwell_boltzmann.set_temp(2500)
maxwell_boltzmann.plot_fv(speed_start, speed_end, ax=ax, c="r", ls="-", label="{:} K".format(maxwell_boltzmann.temp))

maxwell_boltzmann.set_temp(10_000)
maxwell_boltzmann.plot_fv(speed_start, speed_end, ax=ax, c="b", ls="-", label="{:} K".format(maxwell_boltzmann.temp))

ax.legend();
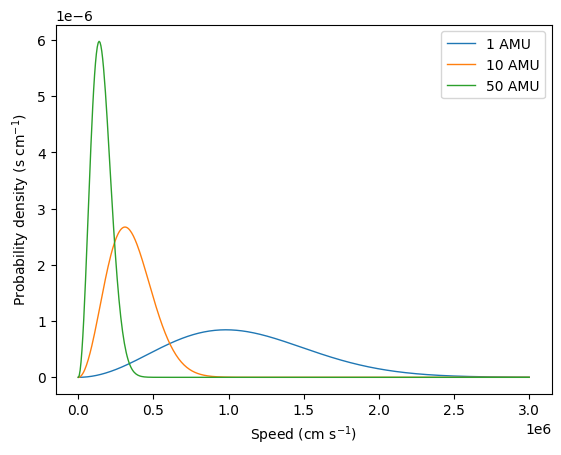
Plot \(f(v)\) on a given speed interval for different masses
[4]:
speed_start = 10  # starting speed in cm/s
speed_end = 3e6   # ending speed in cm/s

fig, ax = plt.subplots()

maxwell_boltzmann.set_temp(5800)
maxwell_boltzmann.set_mass(1)
maxwell_boltzmann.plot_fv(speed_start, speed_end, ax=ax, c="C0", ls="-", label="{:} AMU".format(maxwell_boltzmann.mass))

maxwell_boltzmann.set_mass(10)
maxwell_boltzmann.plot_fv(speed_start, speed_end, ax=ax, c="C1", ls="-", label="{:} AMU".format(maxwell_boltzmann.mass))

maxwell_boltzmann.set_mass(50)
maxwell_boltzmann.plot_fv(speed_start, speed_end, ax=ax, c="C2", ls="-", label="{:} AMU".format(maxwell_boltzmann.mass))

ax.legend();
[ ]:
[ ]:
[ ]: